Terebeep
Short Description
In this challenge only this wave file was given without any further information. In the end, it was an SSTV (Slow Scan TeleVision) transmission, what can be used to transmit images in an analog way. Even though, they used a higher bandwidth as usual, so a manual demodulation has to be performed.
Step 1: Demodulation
After listening to the wave file, we viewed the spectrogram of the signal in Inspectrum. The image shows the beginning of the .wav File.

It seems, that there is one carrier of nonconstant frequency, what would be an indicator for Frequency Modulation. Next, we tried to demodulate the Signal using GNURadio. First, the real signal has to be transformed into a complex one using the Hilbert Transform. To achieve better results, we used a very large window size of 1024 as smaller create additional noise on the signal, that would cause problems later. The complex signal is then frequency demodulated using the “Quadrature Demod” block and the result is written to a .wav file.

The demodulated signal was then analyzed in Audacity, which shows a somehow structured signal. Even though this seems to be no digital modulation we know.

Step 2: Convert to an Image
We noticed periodic dips in the signal encapsulating a pattern repeating 3 times. At some point, we came up with the idea, that these dips (sounds like ‘clicks’ in the original signal) could be a clock signal for the beginning of a row of an image. We tried to split the signal into individual rows and visualize them using the following script.
from scipy.io.wavfile import read
import numpy as np
import pylab as plt
import top_block as tb

tb.main()
plt.ion()
plt.set_cmap("gray")
a = read("fmdemod.wav")
x = map(float, a[1])

while True:
    rowlen = 41109#int(raw_input("Rowlen: "))
    i = 10000#int(raw_input("Offset: "))
    img = []
    while i+rowlen < len(x):
        img += [x[i:i+rowlen]]
        i += rowlen

    img = np.array(img)
    plt.imshow(img, interpolation='bilinear', aspect='auto')
    plt.draw()
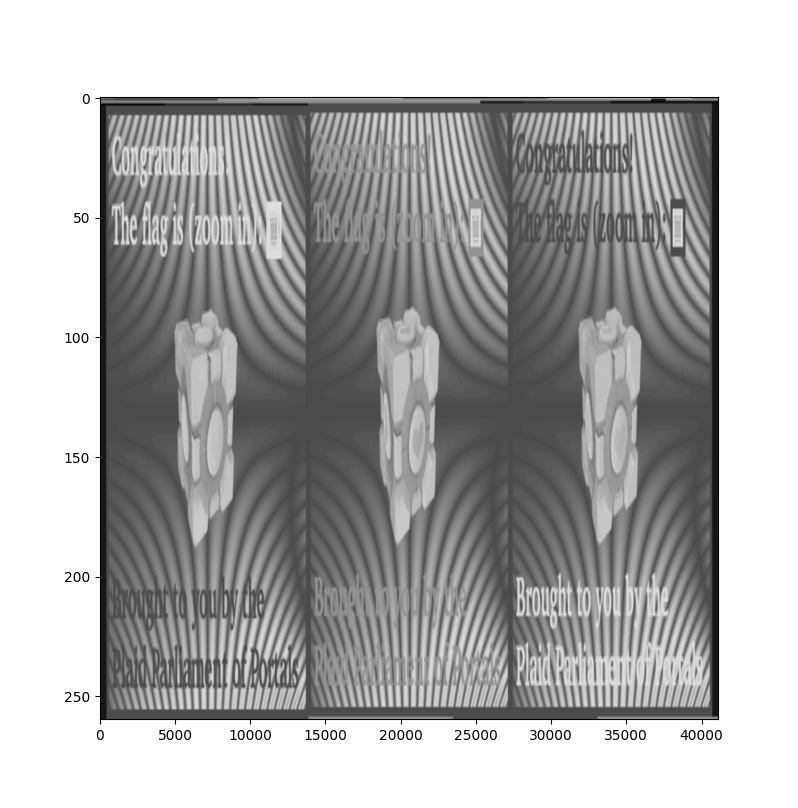
By experimenting with the parameters, an image is visible with separated RGB channels \o/

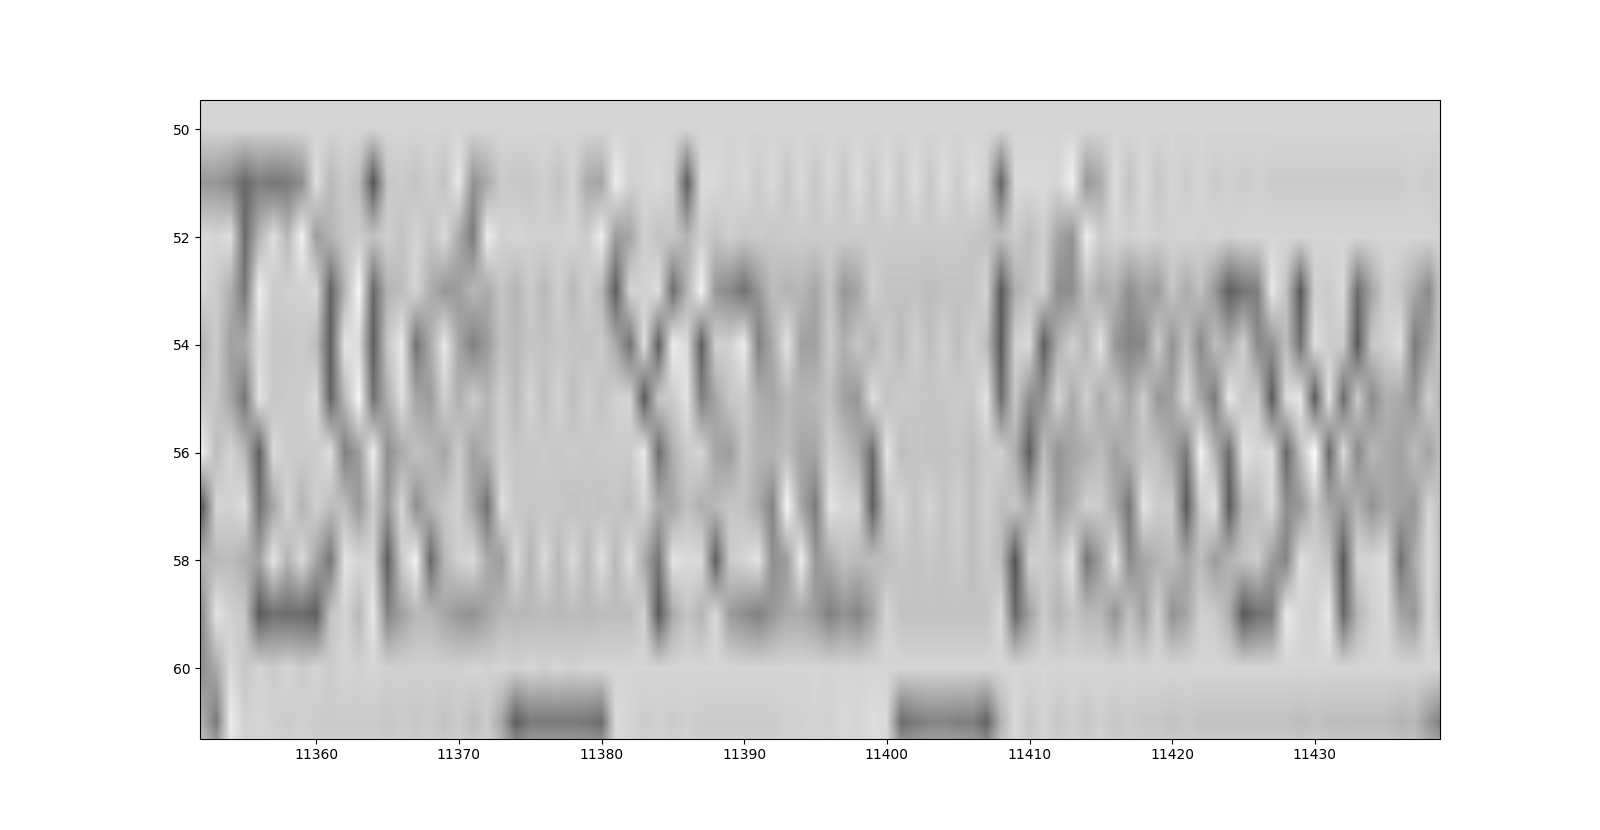
By zooming in we can barely read the Flag: PCTF{Did_You_Know_the_ISS_Sends_Slow_Scan_TV_Images?_506063fd}
